Brandtree in numbers
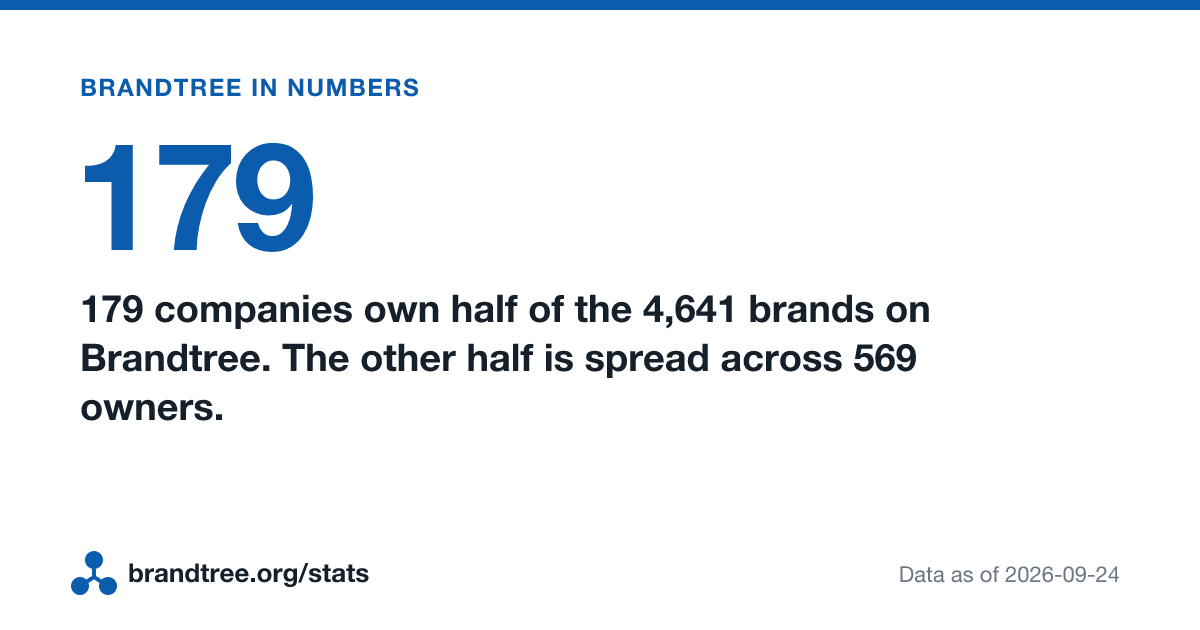
179 companies own half of the 4,641 brands on Brandtree. The other half is spread across 569 owners.
Every figure below is computed from the 4,641 brands on Brandtree whose owner is verified from a filing, as of . These are statistics about this dataset, not the whole market. Brandtree adds a company when its filings list its brands, so large owners are better covered than small ones, and shares here will run higher than a census of every brand would find. Licensed brands and minority stakes are not counted as ownership. The numbers are recalculated on every update.
Headline findings
-
179
179 companies own half of the 4,641 brands on Brandtree. The other half is spread across 569 owners.
The figures · Share image: wide, square
-
55
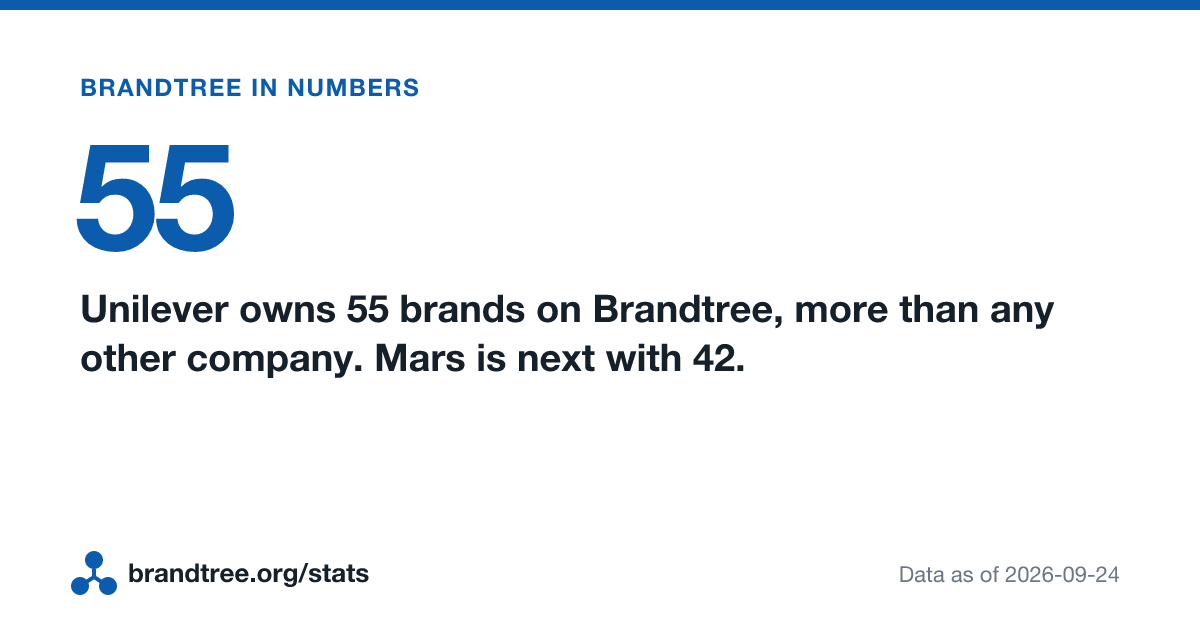
Unilever owns 55 brands on Brandtree, more than any other company. Mars is next with 42.
The figures · Share image: wide, square
-
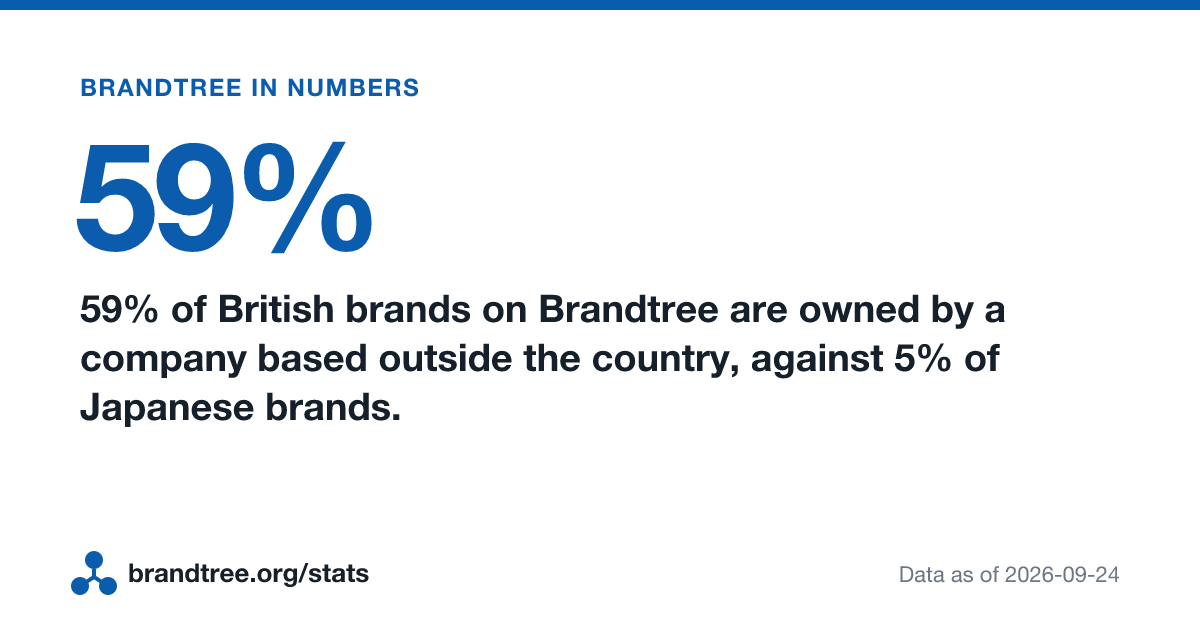
59%
59% of British brands on Brandtree are owned by a company based outside the country, against 5% of Japanese brands.
The figures · Share image: wide, square
-
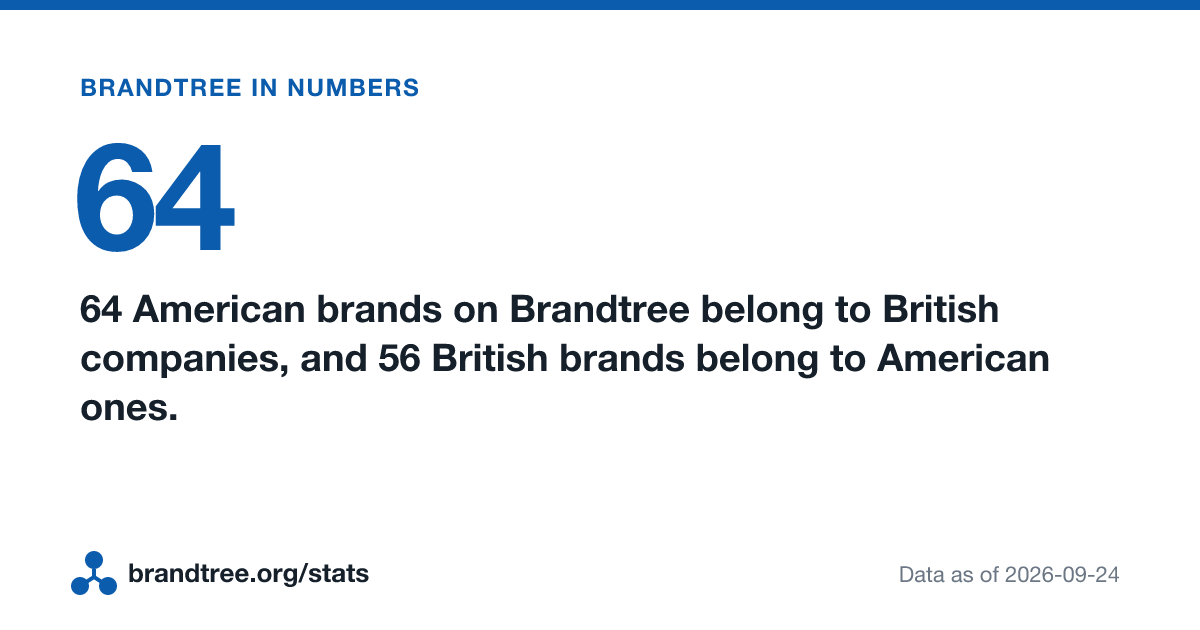
64
64 American brands on Brandtree belong to British companies, and 56 British brands belong to American ones.
The figures · Share image: wide, square
-
90
90 brands on Brandtree have a different owner from a year ago. The largest single move took 14 brands from Unilever to The Magnum Ice Cream Company.
The figures · Share image: wide, square
-
48%
Three companies own 48% of the 73 automotive brands on Brandtree: Bajaj Auto, Stellantis and Volkswagen Group.
The figures · Share image: wide, square
-
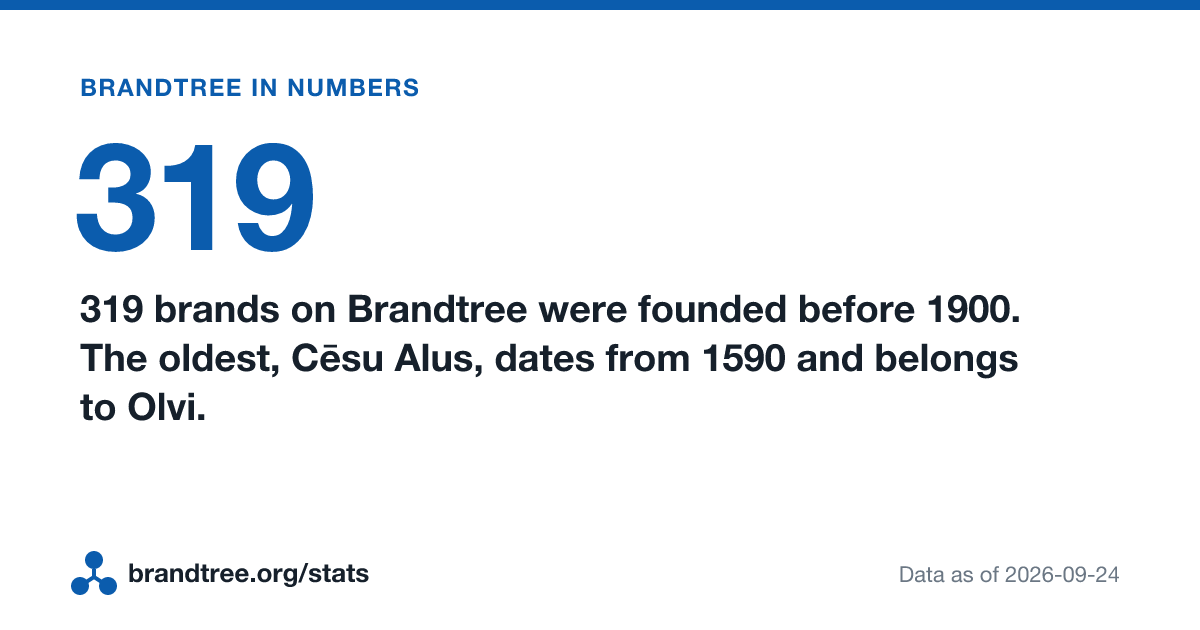
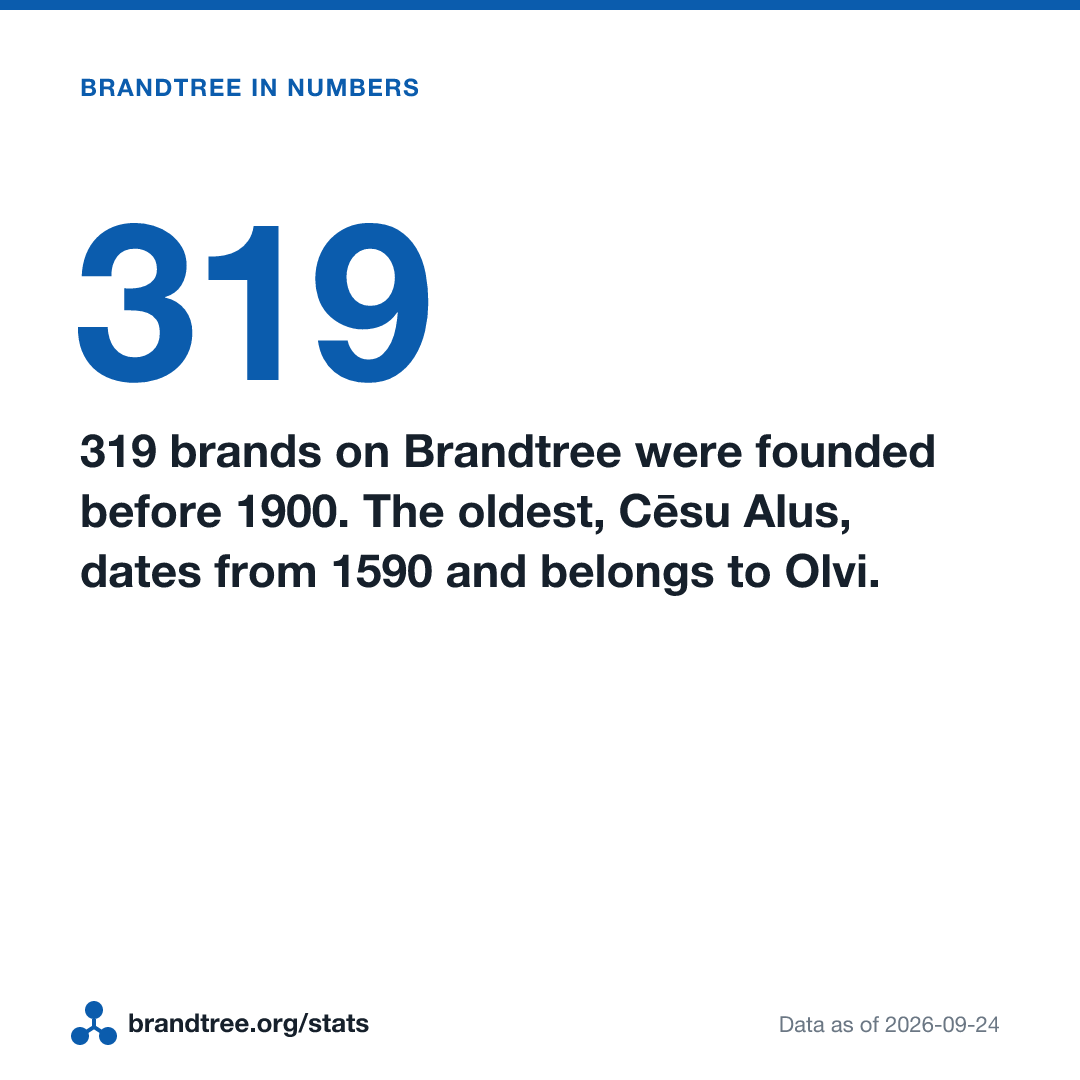
319
319 brands on Brandtree were founded before 1900. The oldest, Cēsu Alus, dates from 1590 and belongs to Olvi.
The figures · Share image: wide, square
-
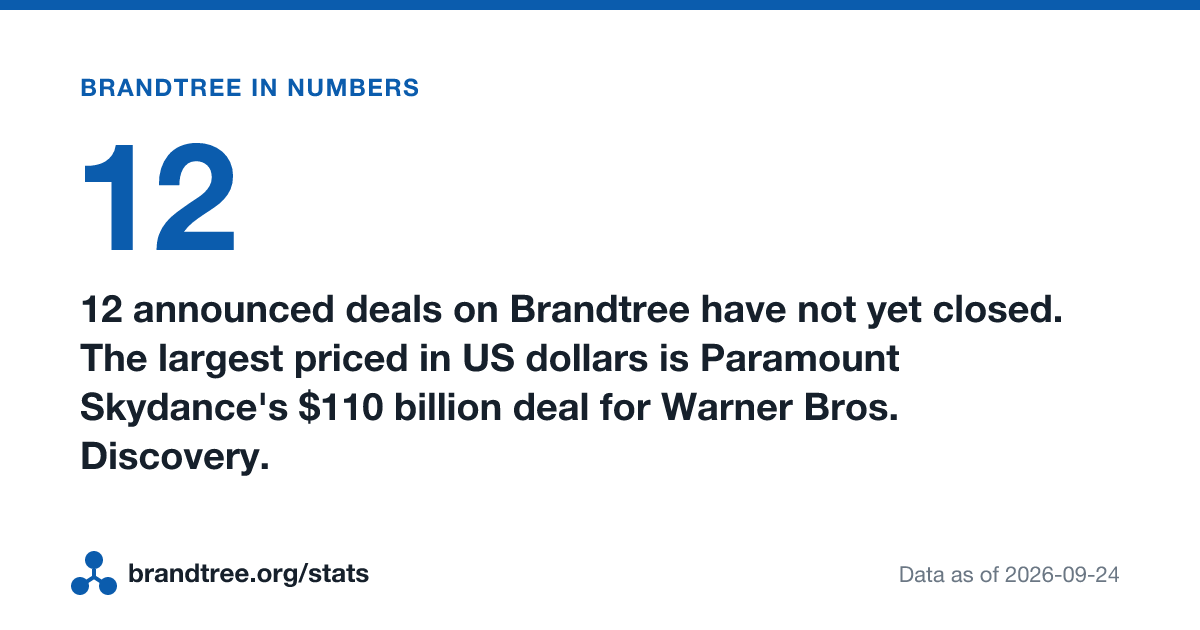
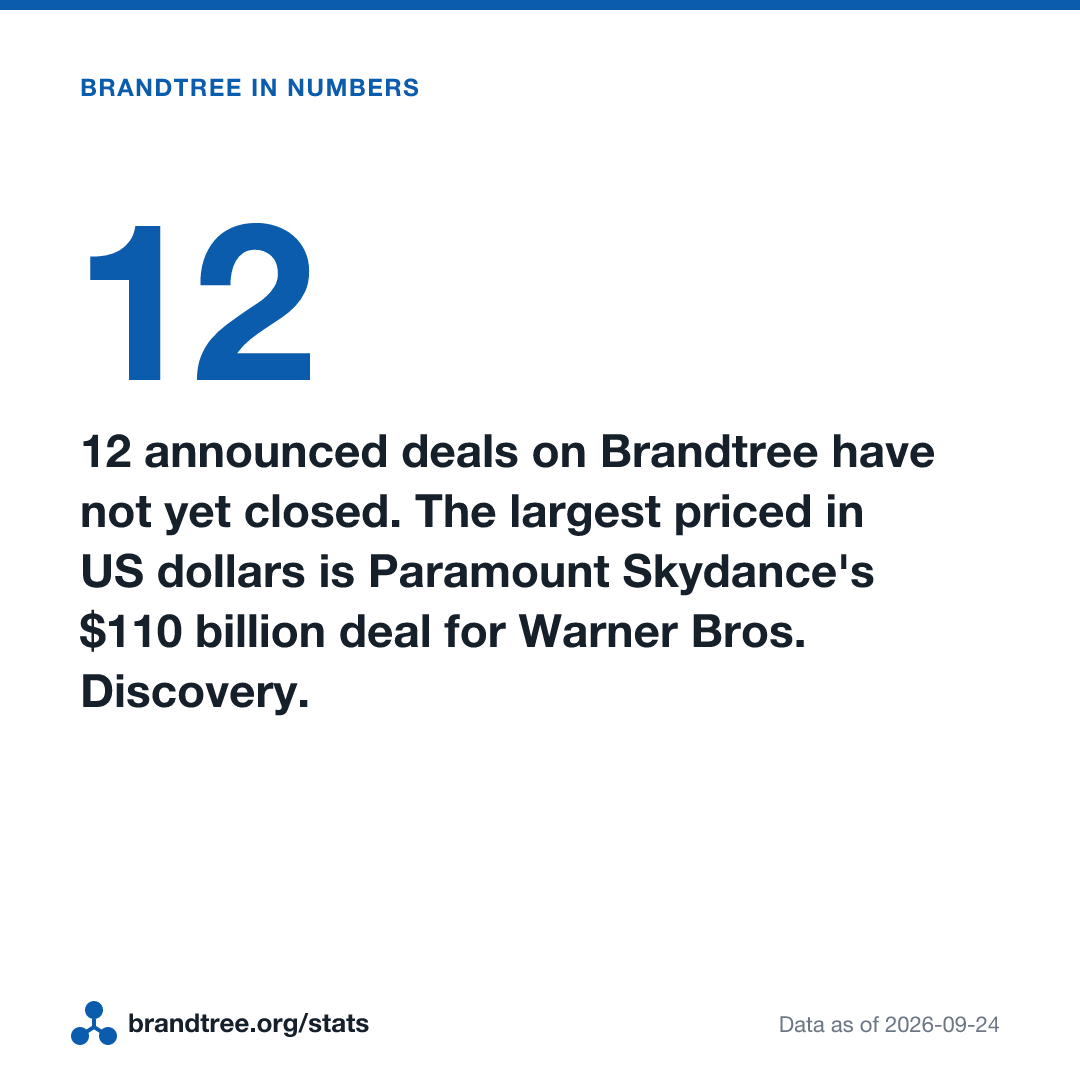
12
12 announced deals on Brandtree have not yet closed. The largest priced in US dollars is Paramount Skydance's $110 billion deal for Warner Bros. Discovery.
The figures · Share image: wide, square
How concentrated ownership is
179 of the 748 ultimate owners on Brandtree account for half of its brands. The ten largest own 7% between them.
Brands owned from abroad
1,167 of 4,641 brands (25%) belong to a company headquartered outside the country the brand comes from. Countries with fewer than 25 brands on Brandtree are left out of the table.
| Brands from | Brands | Foreign-owned | Share | Share, as a bar |
|---|---|---|---|---|
| 🇮🇹 Italy | 82 | 49 | 60% | |
| 🇬🇧 United Kingdom | 290 | 171 | 59% | |
| 🇸🇪 Sweden | 44 | 26 | 59% | |
| 🇪🇸 Spain | 53 | 30 | 57% | |
| 🇳🇱 Netherlands | 32 | 18 | 56% | |
| 🇩🇪 Germany | 105 | 49 | 47% | |
| 🇫🇷 France | 133 | 61 | 46% | |
| 🇳🇿 New Zealand | 30 | 13 | 43% | |
| 🇫🇮 Finland | 28 | 12 | 43% | |
| 🇦🇺 Australia | 76 | 31 | 41% | |
| 🇨🇦 Canada | 57 | 23 | 40% | |
| 🇦🇷 Argentina | 47 | 19 | 40% | |
| 🇲🇽 Mexico | 61 | 23 | 38% | |
| 🇳🇬 Nigeria | 38 | 14 | 37% | |
| 🇨🇭 Switzerland | 52 | 18 | 35% | |
| 🇺🇦 Ukraine | 27 | 8 | 30% | |
| 🇺🇸 United States | 1179 | 325 | 28% | |
| 🇪🇬 Egypt | 28 | 7 | 25% | |
| 🇸🇮 Slovenia | 28 | 7 | 25% | |
| 🇩🇰 Denmark | 31 | 7 | 23% | |
| 🇻🇳 Vietnam | 36 | 7 | 19% | |
| 🇲🇾 Malaysia | 33 | 6 | 18% | |
| 🇵🇪 Peru | 28 | 5 | 18% | |
| 🇿🇦 South Africa | 70 | 12 | 17% | |
| 🇨🇿 Czech Republic | 30 | 5 | 17% | |
| 🇧🇷 Brazil | 52 | 7 | 13% | |
| 🇨🇴 Colombia | 46 | 5 | 11% | |
| 🇨🇱 Chile | 31 | 3 | 10% | |
| 🇹🇷 Turkey | 34 | 3 | 9% | |
| 🇨🇳 China | 74 | 5 | 7% | |
| 🇵🇱 Poland | 41 | 3 | 7% | |
| 🇮🇳 India | 86 | 5 | 6% | |
| 🇹🇭 Thailand | 50 | 3 | 6% | |
| 🇯🇵 Japan | 154 | 8 | 5% | |
| 🇮🇩 Indonesia | 61 | 3 | 5% | |
| 🇰🇷 South Korea | 67 | 2 | 3% | |
| 🇪🇨 Ecuador | 36 | 1 | 3% | |
| 🇰🇪 Kenya | 44 | 1 | 2% | |
| 🇧🇩 Bangladesh | 47 | 0 | 0% | |
| 🇵🇭 Philippines | 32 | 0 | 0% | |
| 🇱🇰 Sri Lanka | 29 | 0 | 0% | |
| 🇮🇸 Iceland | 26 | 0 | 0% |
The largest cross-border links
- 64 American brands owned from the United Kingdom
- 56 British brands owned from the United States
- 29 American brands owned from France
- 28 American brands owned from Canada
- 25 American brands owned from Japan
- 24 American brands owned from Switzerland
- 23 American brands owned from the Netherlands
- 22 American brands owned from Italy
- 20 American brands owned from Ireland
- 16 American brands owned from Germany
Where foreign owners are based
- 🇺🇸 United States: 173 brands from other countries
- 🇬🇧 United Kingdom: 117 brands from other countries
- 🇫🇷 France: 89 brands from other countries
- 🇳🇱 Netherlands: 75 brands from other countries
- 🇨🇭 Switzerland: 52 brands from other countries
- 🇮🇪 Ireland: 51 brands from other countries
- 🇯🇵 Japan: 49 brands from other countries
- 🇮🇹 Italy: 39 brands from other countries
- 🇨🇦 Canada: 38 brands from other countries
- 🇩🇪 Germany: 36 brands from other countries
Brands that changed owner in the past year
90 brands have a different ultimate owner from a year ago. A brand counts as moved when it is sold on its own and also when the company above it is bought, merged or split off. Where the dataset records no owner a year earlier, the list says so rather than calling the brand independent.
- 14 to The Magnum Ice Cream Company from Unilever: Ben & Jerry's, Breyers, Calippo, Carte d'Or, Cornetto and Klondike and 8 more
- 11 to Gildan (no owner on record a year earlier): Bali, Berlei (Australia, New Zealand and South Africa), Bonds, Bras N Things, Comfortwash and Hanes and 5 more
- 10 to Mars from Kellanova: Cheez-It, Crunchy Nut, Eggo, Extra, Nutri-Grain and Pop-Tarts and 4 more
- 8 to Keurig Dr Pepper from JDE Peet's: Douwe Egberts, Jacobs, Kenco, L'OR, Moccona and Peet's Coffee and 2 more
- 7 to Lactalis (no owner on record a year earlier): Anchor, Anlene, Anmum, Kapiti, Mainland and Perfect Italiano and 1 more
- 6 to Valeo Foods (no owner on record a year earlier): Hyper, Maxi, Mirage, Naya, Prestige and Roden Kray
- 5 to Ferrero from WK Kellogg Co: Froot Loops, Frosted Flakes, Kellogg's Corn Flakes, Raisin Bran and Rice Krispies
- 3 to Bajaj Auto from Bajaj Mobility: GASGAS, Husqvarna Motorcycles and KTM
- 2 to B&G Foods (no owner on record a year earlier): College Inn and Kitchen Basics
- 2 to UAC of Nigeria (no owner on record a year earlier): Chivita and Hollandia
- 1 to C&C Group (no owner on record a year earlier): Innis & Gunn
- 1 to Church & Dwight (no owner on record a year earlier): Miss Mouth's Messy Eater
- 1 to Danone (no owner on record a year earlier): Huel
- 1 to Delta Galil (no owner on record a year earlier): Daily Drills
- 1 to eBay from Etsy: Depop
- 1 to Emmi (no owner on record a year earlier): The English Cheesecake Company
- 1 to Gloria (no owner on record a year earlier): San Mateo
- 1 to GraceKennedy (no owner on record a year earlier): Tastee
- 1 to Henkel (no owner on record a year earlier): OLAPLEX
- 1 to L'Oréal (no owner on record a year earlier): Creed
- 1 to Marzetti (no owner on record a year earlier): Bachan's
- 1 to MJ Topco from LVMH: Marc Jacobs
- 1 to MK Group (no owner on record a year earlier): Dijamant
- 1 to Molinos (no owner on record a year earlier): Etchart
- 1 to Morinaga (no owner on record a year earlier): My/Mochi
- 1 to Picea from iRobot: Roomba
- 1 to Prestige Consumer Healthcare (no owner on record a year earlier): Breathe Right
- 1 to Savencia Fromage & Dairy (no owner on record a year earlier): Valrhona
- 1 to Titan (no owner on record a year earlier): Damas
- 1 to TITAN (no owner on record a year earlier): Keystone Cement
- 1 to Unilever (no owner on record a year earlier): Grüns
- 1 to VRG (no owner on record a year earlier): Lilou
Consolidation over time: owner changes by year and how the largest owners built their portfolios →
Concentration by category
The share of each category's brands held by its three largest owners. Categories with fewer than 40 brands or 10 owners are left out.
| Category | Brands | Owners | Top three | Top three share, as a bar | Largest owners |
|---|---|---|---|---|---|
| Automotive | 73 | 14 | 48% | Bajaj Auto (15), Stellantis (11), Volkswagen Group (9) | |
| Tobacco & nicotine | 93 | 13 | 43% | Imperial Brands (20), British American Tobacco (11), Altria (9) | |
| Pet & animal care | 75 | 25 | 37% | VAFO (12), Mars (11), Kormotech (5) | |
| Restaurants & foodservice | 73 | 30 | 32% | Jollibee Group (12), Inspire Brands (6), CP Foods (5) | |
| Travel & hospitality | 92 | 20 | 30% | Genting (12), Marriott (8), Minor International (8) | |
| Consumer health | 78 | 23 | 27% | Krka (8), Reckitt (7), Genomma Lab (6) | |
| Personal care & beauty | 339 | 76 | 23% | Unilever (34), Procter & Gamble (23), L'Oréal (21) | |
| Media & entertainment | 117 | 30 | 21% | Disney (10), Warner Bros. Discovery (8), Canal+ (7) | |
| Home, garden & DIY | 272 | 84 | 14% | Corporación Favorita (16), Shoprite Group (12), Mohawk (11) | |
| Internet & digital | 226 | 69 | 14% | Alphabet (13), Kaspi.kz (10), Expedia Group (9) | |
| Home care | 246 | 76 | 13% | Arçelik (13), Procter & Gamble (11), Clorox (8) | |
| Apparel, footwear & accessories | 341 | 96 | 11% | LVMH (13), Gildan (12), Richemont (11) | |
| Beverages | 978 | 207 | 8% | Heineken (29), Coca-Cola (23), Diageo (23) | |
| Food | 1638 | 316 | 5% | Mars (31), Mondelēz (26), Ferrero (23) |
How old the brands are
A founding year is recorded for 2,800 brands. The median was founded in 1976, and 319 date from before 1900. The oldest:
- 1590 Cēsu Alus, now owned by Olvi
- 1615 Grolsch, now owned by Asahi Group
- 1629 Tyskie, now owned by Asahi Group
- 1664 Kronenbourg 1664, now owned by Carlsberg
- 1703 Mount Gay, now owned by Rémy Cointreau
Who the owners are
Brands by the kind of company at the top of their ownership chain.
| Ultimate owner | Brands | Share |
|---|---|---|
| Publicly listed | 3442 | 74% |
| Privately held | 871 | 19% |
| Family-owned | 186 | 4% |
| Cooperative | 67 | 1% |
| State-owned | 26 | 1% |
| Private-equity | 20 | <1% |
| Holding | 18 | <1% |
| Trust-owned | 11 | <1% |
Deals
Brandtree records 302 completed deals and 12 that have been announced but not closed. Deal values are shown in the currency the filing gave; they are not added together or converted, because that would need an exchange rate at each deal's date.
Largest completed deals priced in US dollars
- $71.3 billion Disney: 20th Century Studios and National Geographic (Mar 2019)
- $68.7 billion Microsoft: Activision Blizzard (Oct 2023)
- $63 billion Bayer: Roundup (Jun 2018)
- $57 billion Procter & Gamble: Gillette and Oral-B (Oct 2005)
- $55 billion PIF, Silver Lake and Affinity Partners: EA (Aug 2026)
Largest in each other currency
- €15.7 billion Keurig Dr Pepper: JDE Peet's
- £79 billion AB InBev: Castle Lager and Aguila
- A$16 billion Asahi Group: Carlton Draught and Victoria Bitter
- NZ$3.85 billion Lactalis: Anchor and Mainland
- CHF 1.5 billion Lindt & Sprüngli: Russell Stover and Whitman's
Most frequent buyers
- Unilever: 17 completed deals
- LVMH: 12 completed deals
- Mars: 9 completed deals
- Volkswagen Group: 7 completed deals
- Richemont: 7 completed deals
- L'Oréal: 6 completed deals
- PepsiCo: 6 completed deals
- Authentic Brands: 6 completed deals
Waiting to close
- Ferrero: Purely Elizabeth (announced Aug 2026)
- Lactalis: Cathedral City and Wensleydale Creamery (announced Aug 2026)
- Kirin: Jamieson Wellness (announced Aug 2026)
- Procter & Gamble: Thorne (announced Aug 2026)
- BBFIT Investments: Bonds and Bras N Things (announced Jul 2026)
- Platinum Equity: Perrier and S.Pellegrino (announced Jul 2026)
- Intersnack: Utz Brands and Utz (announced Jul 2026)
- Authentic Brands: Lee (announced May 2026)
- McCormick: Knorr and Hellmann's (announced Mar 2026)
- Paramount Skydance: Warner Bros. Discovery (announced Feb 2026)
- Anta Sports: Puma (announced Jan 2026)
- Kimberly-Clark: Tylenol and Listerine (announced Nov 2025)
Merger-control decisions
| Outcome | Decisions |
|---|---|
| Cleared with remedies | 10 |
| Cleared | 5 |
| Under investigation | 4 |
| Blocked | 2 |
| Remedies varied | 1 |
What the numbers rest on
1,315 cited documents.
| Source type | Documents | As a bar |
|---|---|---|
| Other official documents | 464 | |
| Annual reports and exchange filings | 393 | |
| SEC filings | 324 | |
| Company press releases | 110 | |
| Regulator decisions and court filings | 24 |
Figures are also published as JSON. Quote them freely under CC BY 4.0, keeping "on Brandtree", or the equivalent, with the number.